KPI/Digital Metrics Displays
Keeping an Eye on Performance
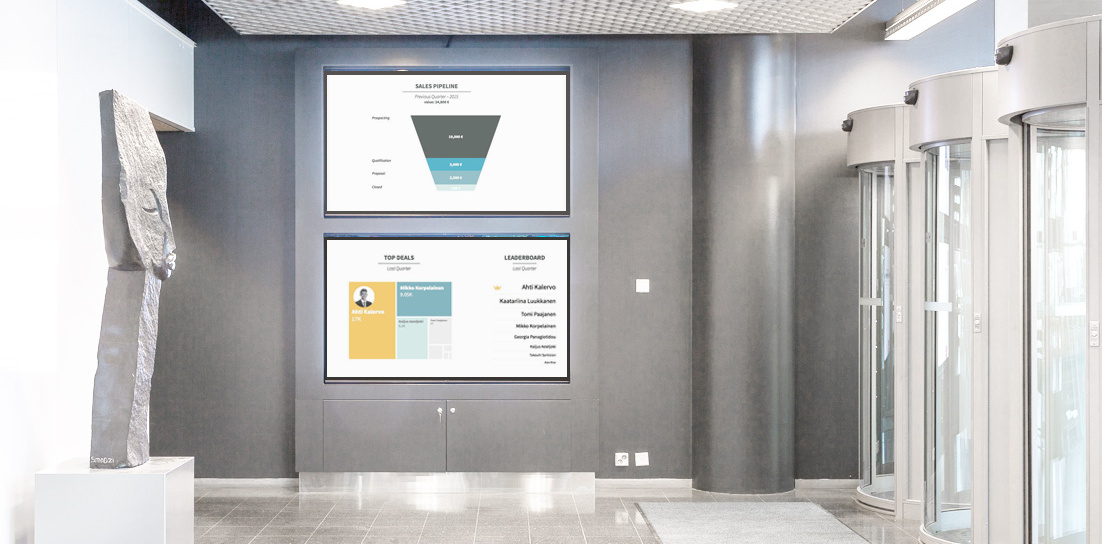
Digital metric displays are an evolutionary product from the whiteboard and scoreboard. Real time and automated business data ensures that relevant content is shown at all times. Use KPI data such as health and safety metrics, sales pipeline, quality or production metrics to increase business relevancy in internal, employee and supply chain communication. Use numbers, graphs, images, animation and video to illustrate your company’s success and progress toward its goals.
Use Digital metrics displays and communicate better:
- Display sales as a number and a graph for comparison
- Display the bottom line and costs e.g. labor, marketing
- Visually display sales/production/growth goals
- Visualize fundraiser progress
- Increase communication and efficiency